Plant Drought Stress Image Processing Summer Project
17 Aug 2018
Over the summer I did some work with a research project that was exploring the use of drones equipped with cameras to analyze plants for agriculture. Altough I didn’t get to play with drones, I did do some data collection and image processing. My goal was to use images of plants to determine if they were “thirsty” i.e. drought stressed.
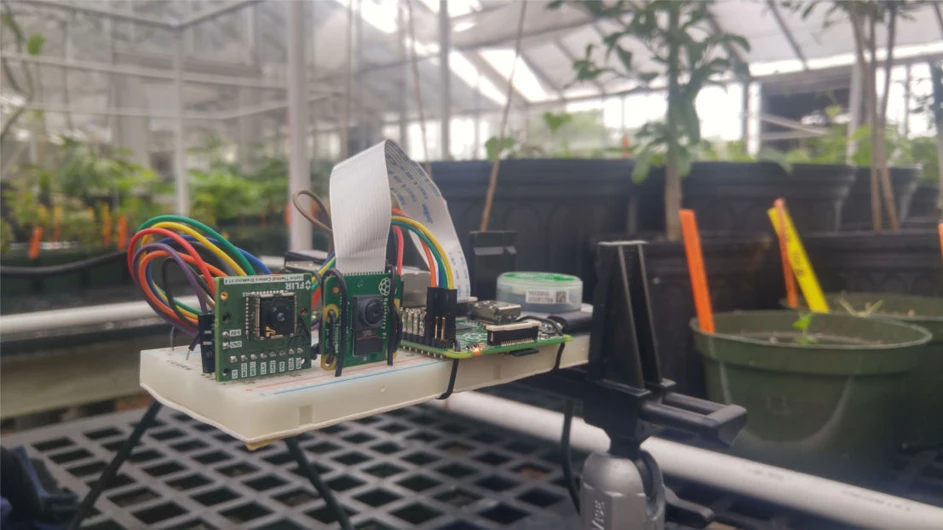
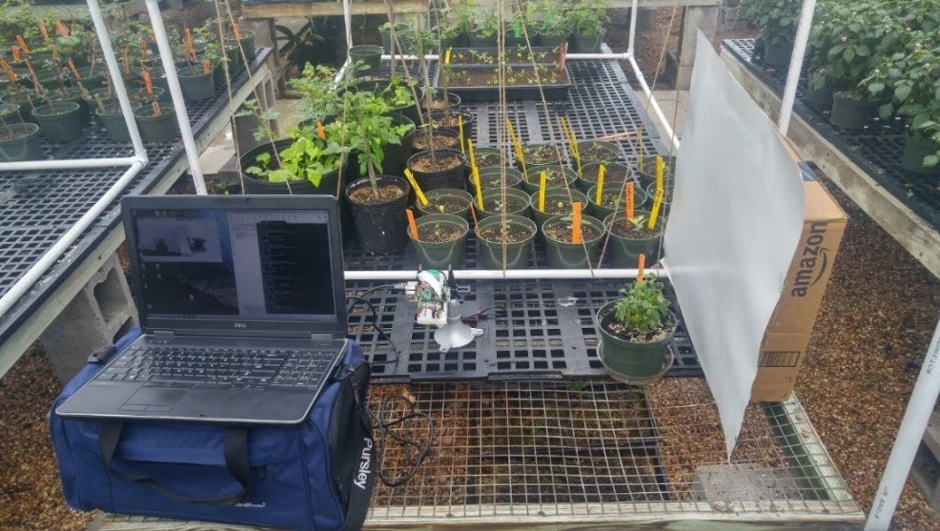 Image capturing set-up in the greenhouse.
Overview
The first thing I had to do was gather some image data of plants, half of which would be drought-stressed. For this task I was given a Raspberry Pi with thermal (IR) and color (VL) cameras. This setup was used as a prototype for something small and portable that could be attached to a drone. I visited the plants at a greenhouse multple times a day to capture the images. Throughout the week I developed and improved a Python script for streamlining the image capturing with the Raspberry Pi. A white background was placed behind the plants to help the future image processing.
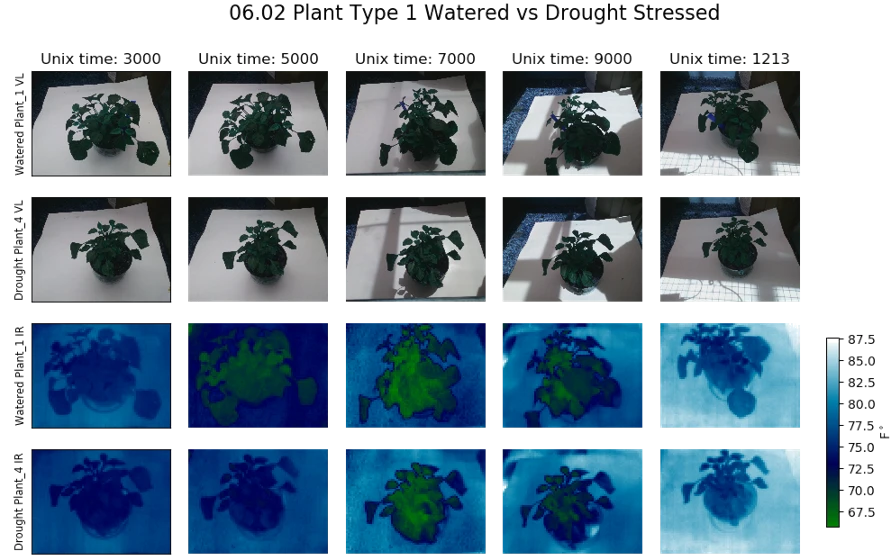 Collection of plant images captured.
With the plant images collected, the “region of interest” (ROIs) could be determined. In this case the ROI was simply the plant and the challenge was to determine the set of pixels that corresponded to it. Using a familiar technique , I almost completely automated this by applying simple threshold and morphological operations (with Python + OpenCV). However, a set of threshold values didn’t work for all images so there was a manual element in changing the values in order to get correct ROIs for all the images.
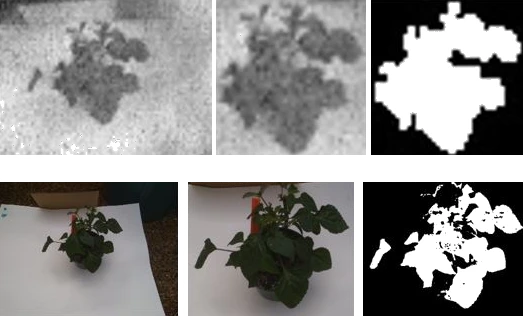 Examples of finding ROIs.
With the ROIs I could find image features. I chose the hue color value for VL images and plant surface temperature for IR images. After plotting those feature’s mean and variance over time, I determined there wasn’t any strong correlation between those values and the amount of time it had been since the plants had been watered. Therefore, the results were inconclusive.
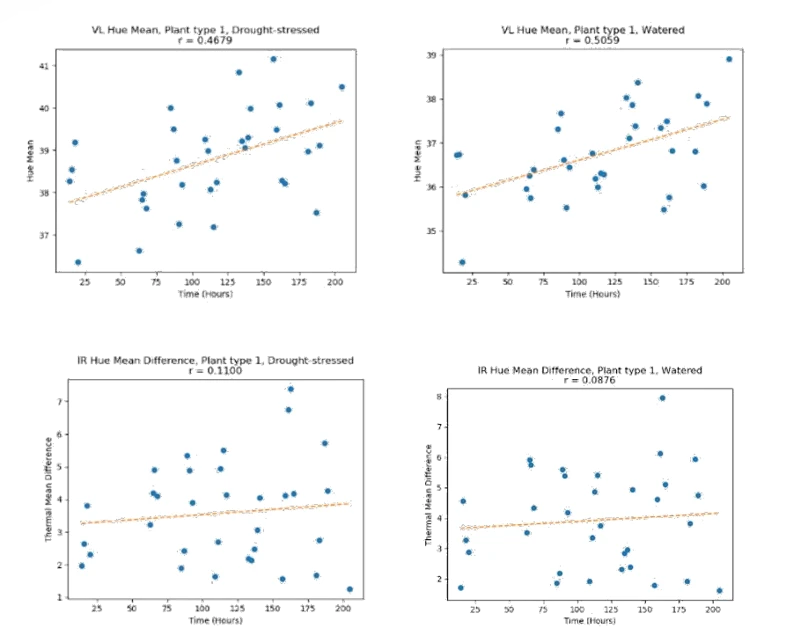 Sample plots of image features (see GitHub for more).
Conclusion
Altough not very advanced, this was an educational project where I had to collect all the data and preform the analysis myself. That meant I had to consider the quality of the data I was collecting and how to make it appropriate for processing. Presenting the data/results was also a challenge. I found Python’s matplotlib to be a great tool for making neat plots and figures.
The Github includes all the data, code, and a report with more details.